Electrostatics Workflow
Command workflow for electrostatics analyses and local visualizations.
This module implements CLI workflow orchestration for its command family, including argument parsing, request construction, execution dispatch, and result presentation handoff.
Usage context
- Command routing: Resolve CLI aliases and normalized command names.
- Task execution: Build request objects and invoke registered tasks.
- Output handling: Forward results to table, plot, export, or report flows.
Command: charge_table
Extract per-atom charges across selected frames. You can filter by atom ids or element types, subsample frames, export tables, and plot charge series on iteration/frame/time axes.
Examples
  1. Export charge table for a frame slice:
   reaxkit charge_table --frames 0:10:2 --export charges.csv

  2. Plot selected atom ids over selected frames:
   reaxkit charge_table --atom-ids 1 2 3 --frames 0,5,10 --plot single

  3. Filter by atom types and save time-axis plot:
   reaxkit charge_table --atom-types O H --every 5 --xaxis time --save charge_series.png
Arguments
| Flag | Required | Default | Help | Choices |
|---|---|---|---|---|
--atom-ids |
No | 1-based atom ids to include. Example: --atom-ids 1 2 3, which keeps only those atoms. | ||
--atom-types |
No | Element symbols to include. Example: --atom-types O H, which keeps only oxygen and hydrogen rows. | ||
--frames |
No | Frame selector syntax. Example: --frames 0,5,10, which evaluates only those three frames. | ||
--every |
No | 1 | Use every Nth selected frame. Example: --every 5, which subsamples selected frames by 5. | |
--control |
No | control | Control file for time-axis conversion. Example: --control control, which provides timestep metadata for time conversion. | |
--plot |
No | Render a plot. Example: --plot single, which makes one combined chart. | single, subplot | |
--show |
No | Show the generated plot window. Example: --show, which opens the chart interactively. | ||
--save |
No | Save the generated plot to a file path. Example: --save charge_series.png, which writes the figure image. | ||
--export |
No | Write the table to CSV. Example: --export charges.csv, which saves tabular output. | ||
--grid |
No | Subplot grid like 2x2 or 2*2. Example: --grid 2x2, which arranges subplot panels in two rows and two columns. | ||
--xaxis |
No | iter | Quantity on x-axis. Example: --xaxis time, which uses converted time instead of iteration index. | iter, frame, time |
The figure below shows an example CSV output for the table of charges for different atoms across different frames.
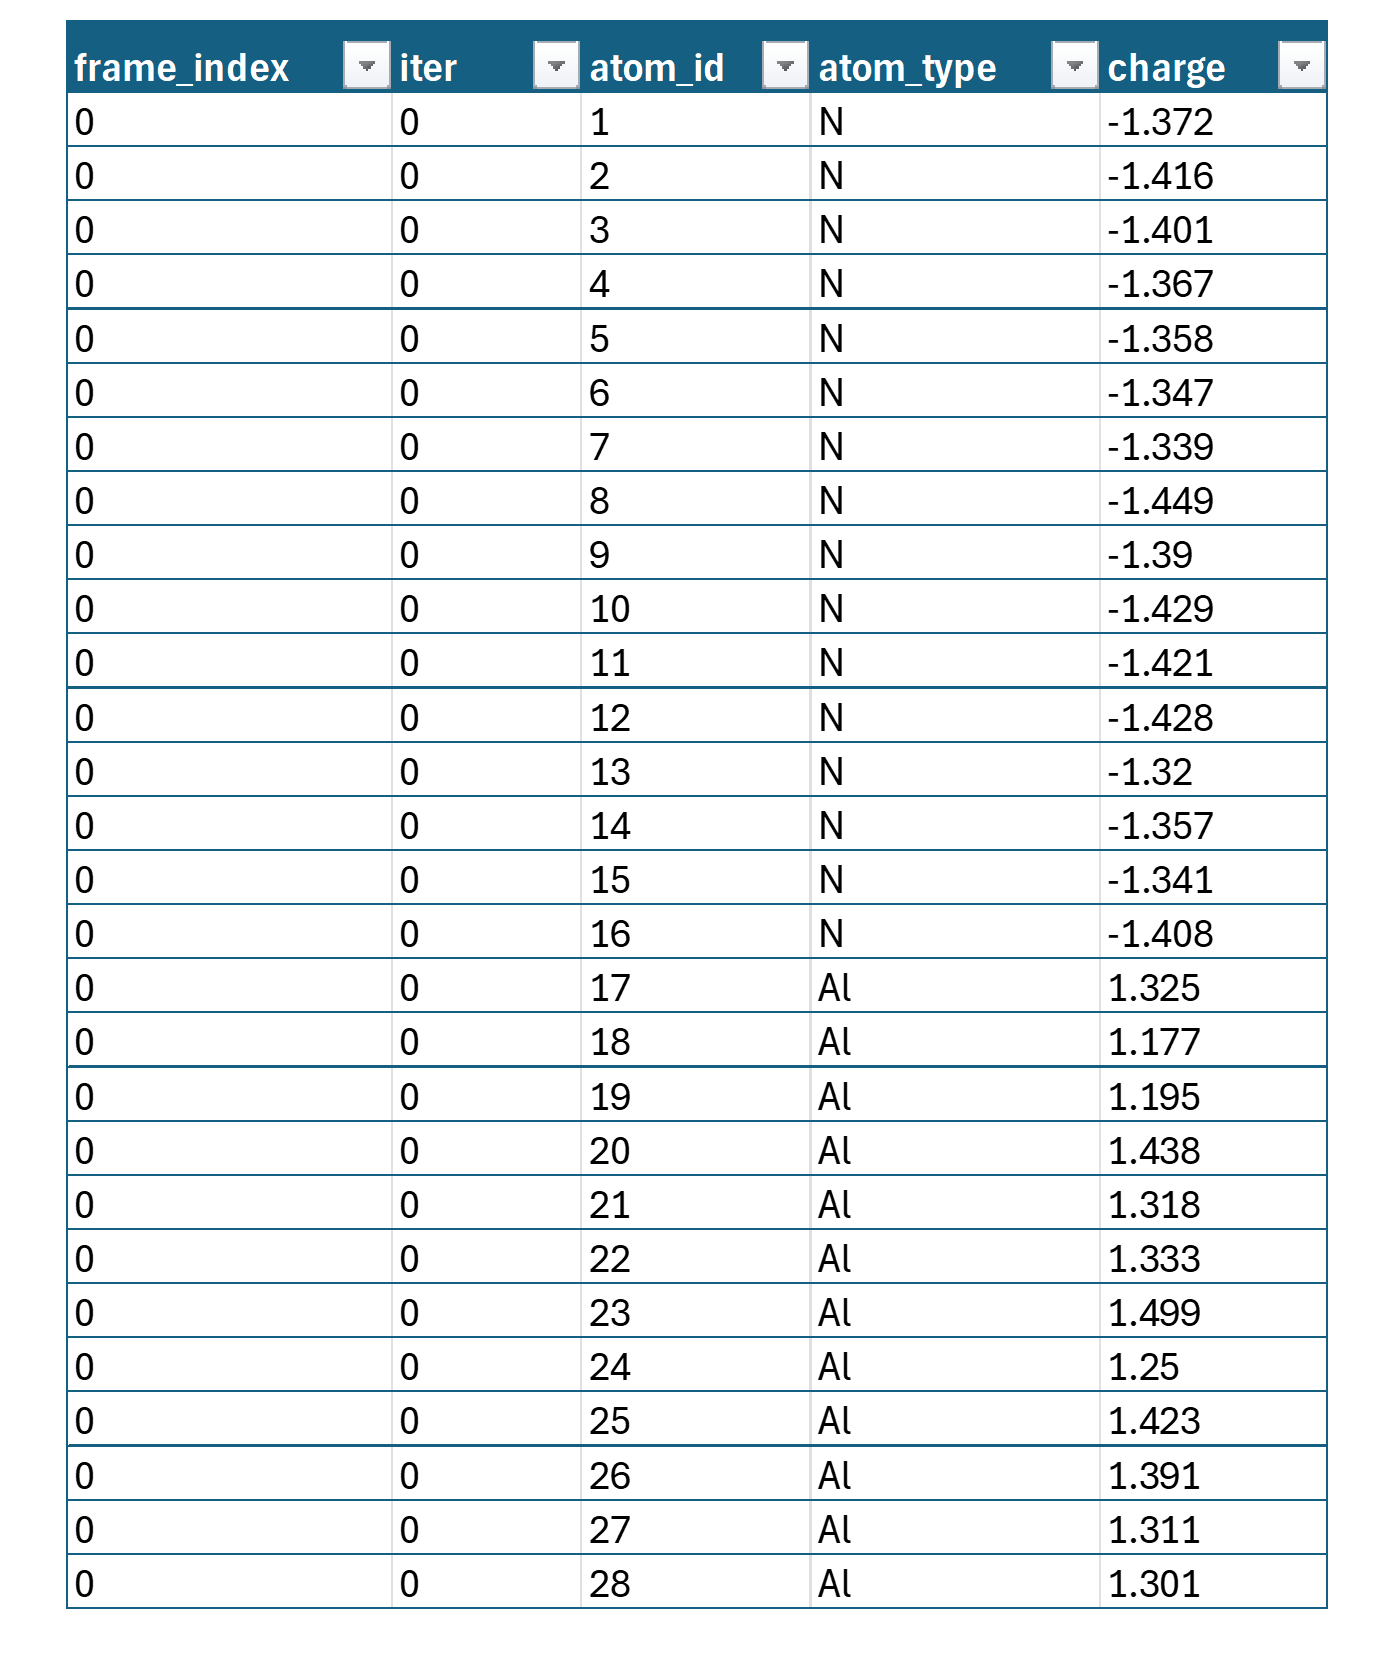
Figure: Sample CSV output for the charges table.
The above data can be pivoted using Excel's pivot table feature to see the charges for atoms across frames in a tabular-format as follows:
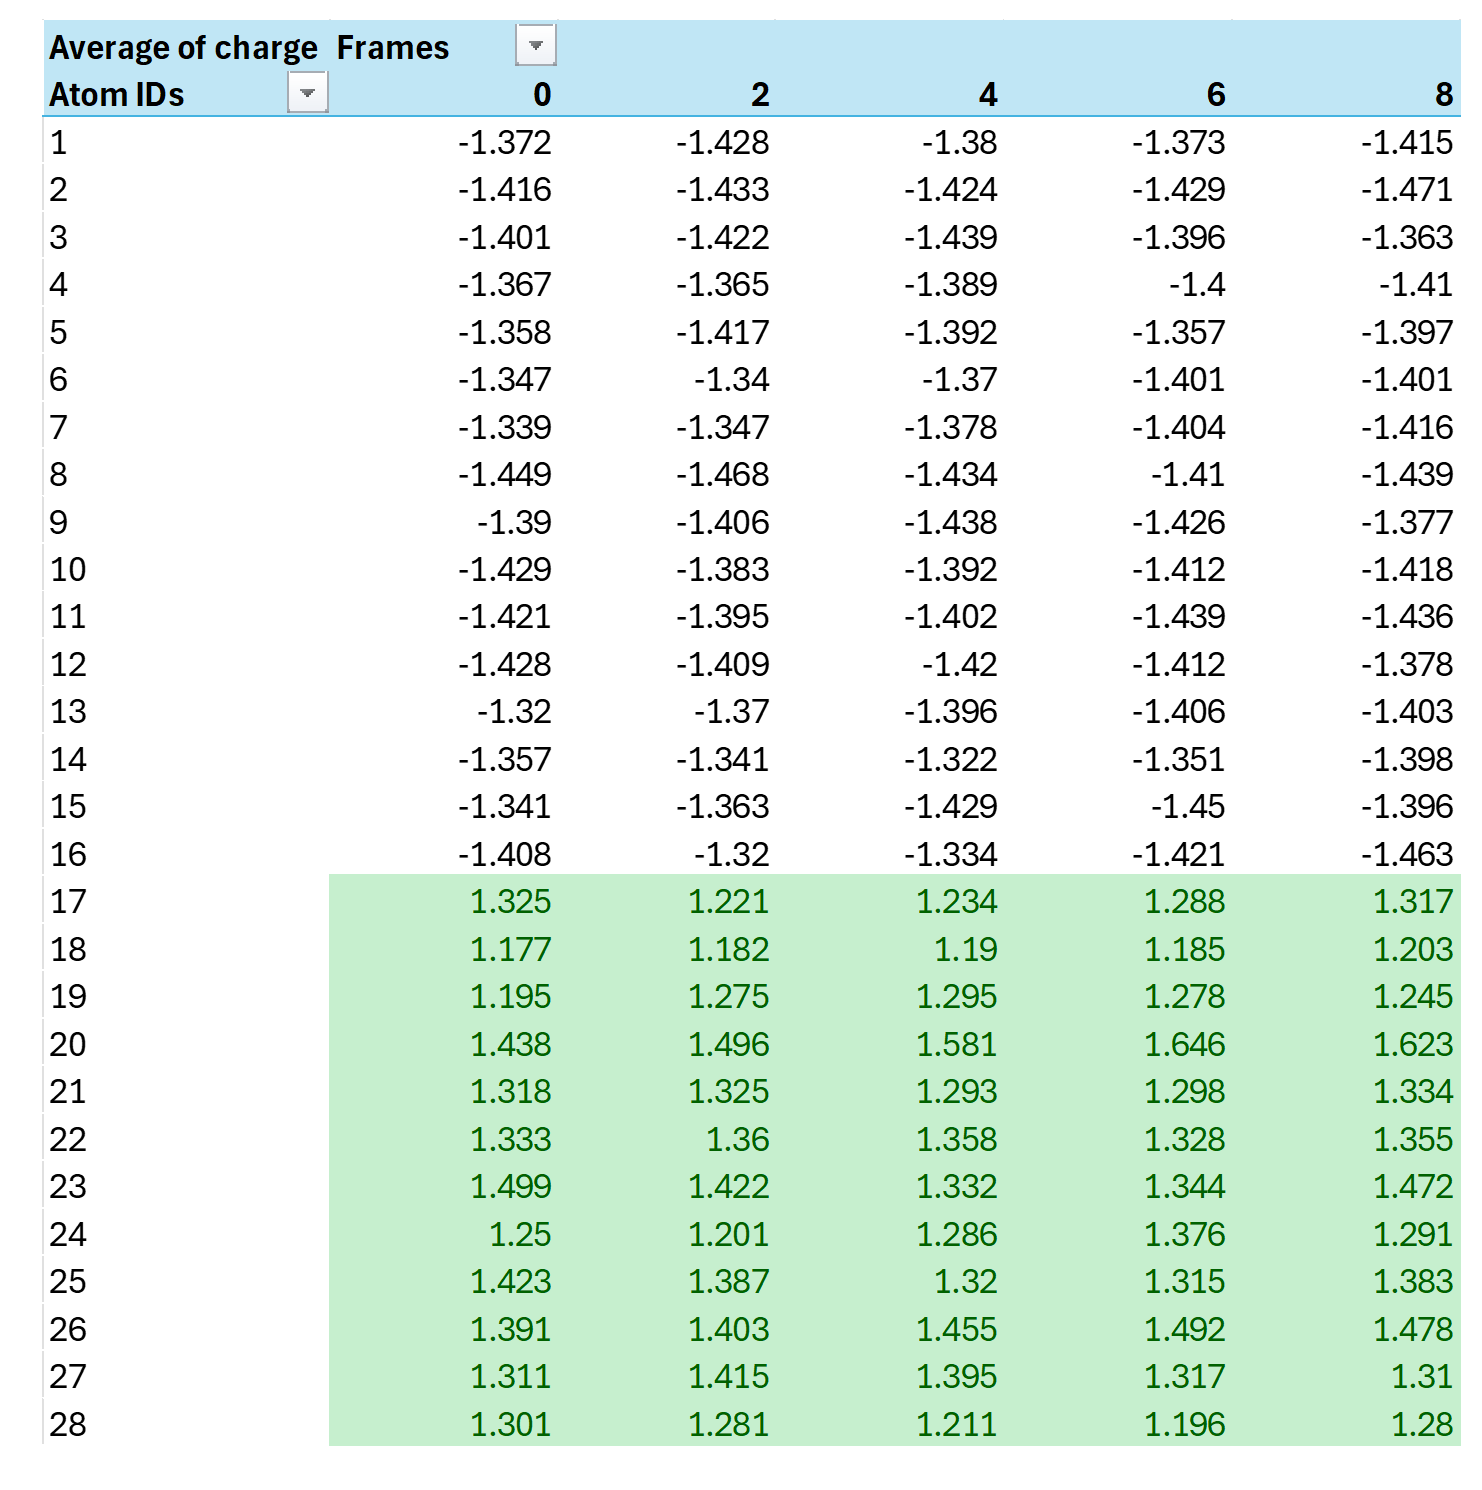
Figure: Sample pivoted data for charge data across frames and atoms.
Command: dipole
Arguments
No command-specific arguments found.
Command: polarization
Arguments
No command-specific arguments found.
Command: polarization_field
Analyze polarization-field hysteresis behavior from trajectory-level data. This command aggregates hysteresis points, plots response curves, exports tables, and can report coercive/remnant roots.
Examples
  1. Plot and save aggregated hysteresis curve:
   reaxkit polarization_field --plot --save hysteresis.png

  2. Customize axes and aggregation, then export:
   reaxkit polarization_field --xaxis field_z --yaxis pol_z --aggregate mean --export hysteresis.csv

  3. Print roots and write a summary text report:
   reaxkit polarization_field --roots --summary hysteresis_summary.txt
Arguments
| Flag | Required | Default | Help | Choices |
|---|---|---|---|---|
--fort78 |
No | fort.78 | Path to fort.78 file. Example: --fort78 runs/job1/fort.78, which reads field-response source data from that file. | |
--control |
No | control | Path to control file. Example: --control runs/job1/control, which provides simulation timing/control metadata. | |
--plot |
No | Render the hysteresis plot. Example: --plot, which generates the hysteresis curve figure. | ||
--save |
No | hysteresis_aggregated.png | Save plot to a file path. Example: --save hysteresis.png, which writes the plotted curve to that image file. | |
--export |
No | hysteresis_aggregated.csv | Write aggregated data to CSV. Example: --export hysteresis.csv, which saves aggregated hysteresis table. | |
--summary |
No | hysteresis_summary.txt | Write coercive fields and remnant polarizations to a text file. Example: --summary hysteresis_summary.txt, which stores root summary values in text form. | |
--yaxis |
No | pol_z | Quantity for y-axis. Example: --yaxis pol_z, which plots z-polarization response on y-axis. | |
--xaxis |
No | field_z | Quantity for x-axis. Example: --xaxis field_z, which uses z-field strength on x-axis. | |
--aggregate |
No | mean | Aggregation method. Example: --aggregate mean, which averages values at each field point. | mean, max, min, last |
--roots |
No | Also print coercive and remnant values to stdout. Example: --roots, which prints root metrics directly in CLI output. |
The figure below shows an example hysteresis plot, where electric field is on x-axis and polarization (or dipole) on the y-axis.
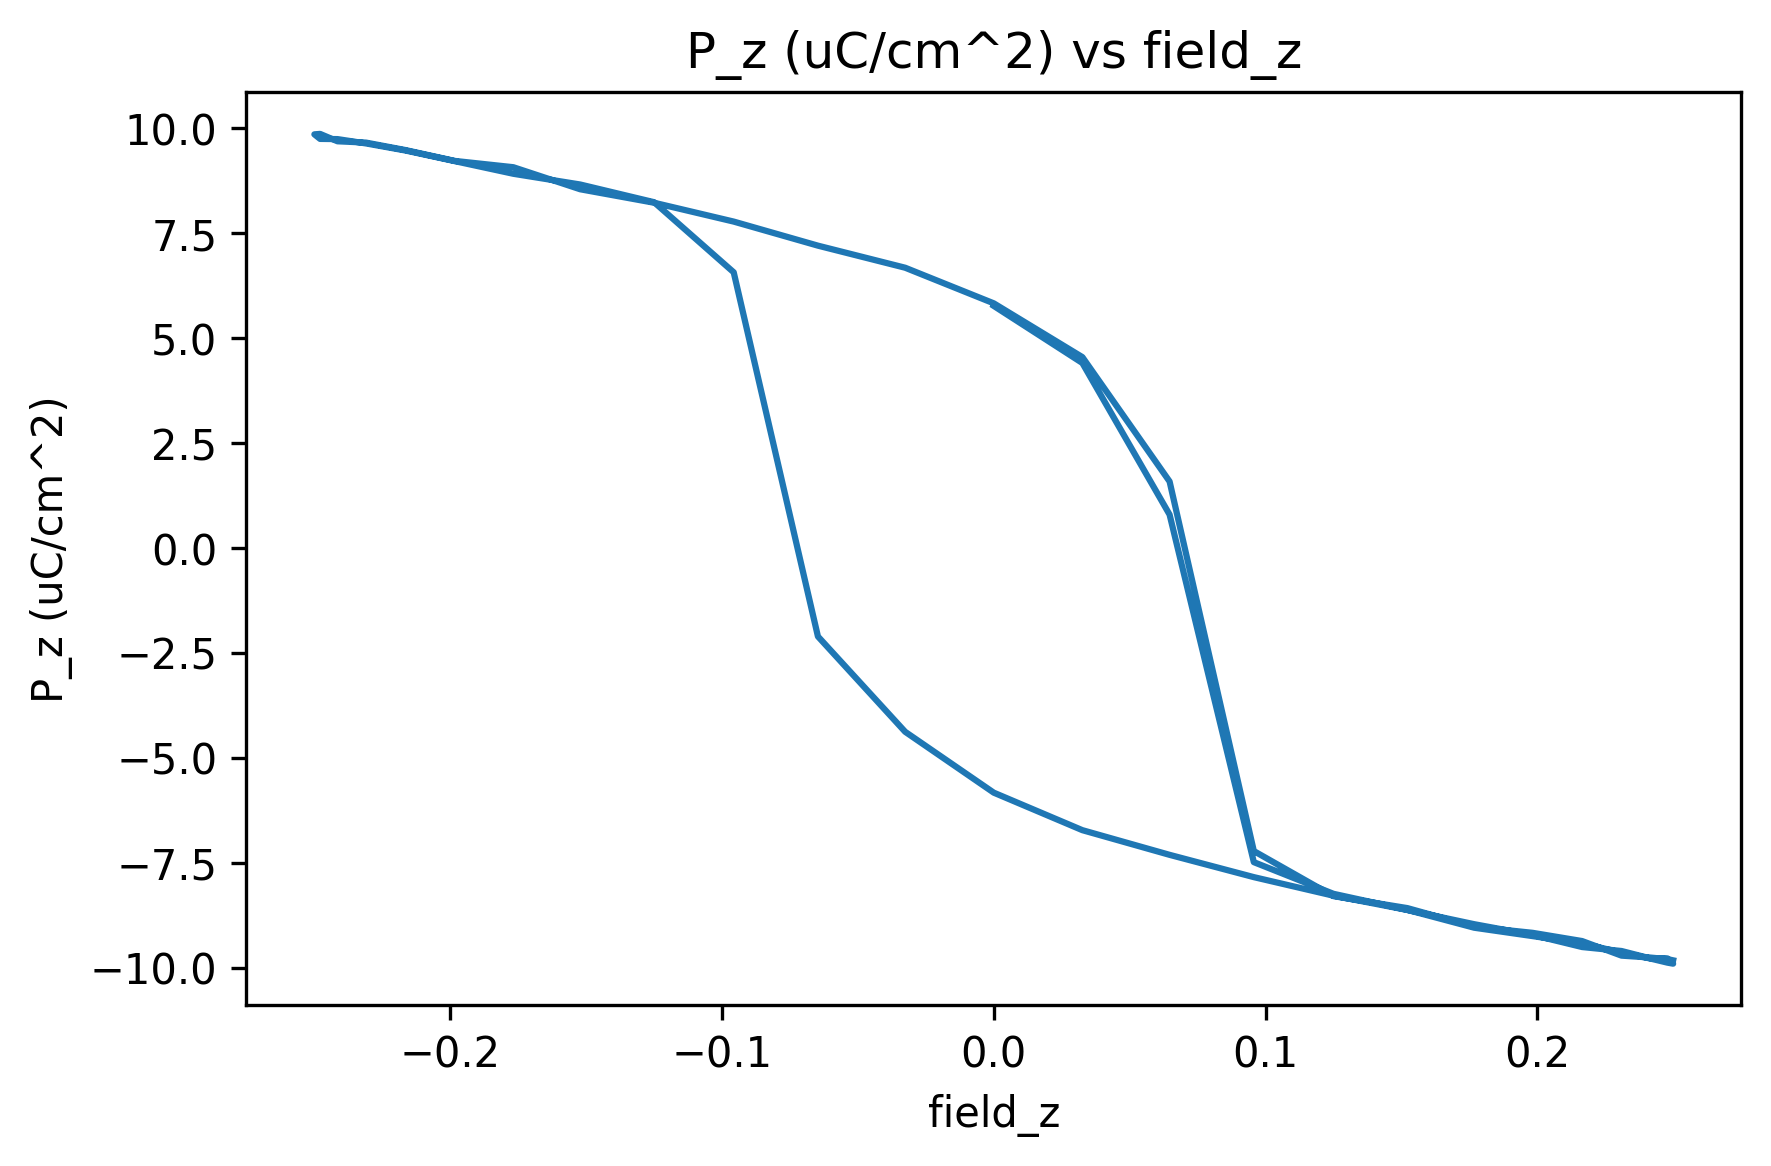
Figure: Sample polarization hysteresis plot.
Common Runtime and Presentation Arguments
These are shared workflow-level CLI flags added before command-specific options, covering runtime context (engine/input/storage) and output presentation/export behavior.
| Flag | Required | Default | Help | Choices |
|---|---|---|---|---|
--engine |
No | Engine override. Example: --engine reaxff, which applies ReaxFF loader/parsing rules. | reaxff, ams, lammps | |
--run-dir, --dir |
No | . | Run directory fallback for detection. Example: --run-dir runs/job1, which sets the base folder for file lookup. | |
--xmolout |
No | xmolout | Path to xmolout file. Example: --xmolout runs/job1/xmolout, which provides trajectory structure data. | |
--fort7 |
No | fort.7 | Path to fort.7 file. Example: --fort7 runs/job1/fort.7, which provides bond-order/charge source data. | |
--run-id |
No | Run identifier for run-scoped layout (e.g., run_91ac0e). | ||
--project-root |
No | Project root that contains inputs/, data/, analysis/, etc. | ||
--analysis-id |
No | Optional analysis artifact id; defaults to run id. |