Plot Atom Property Workflow
Direct command workflow for spatial per-atom property plots.
This module implements CLI workflow orchestration for its command family, including argument parsing, request construction, execution dispatch, and result presentation handoff.
Usage context
- Command routing: Resolve CLI aliases and normalized command names.
- Task execution: Build request objects and invoke registered tasks.
- Output handling: Forward results to table, plot, export, or report flows.
Command: plot_atom_property
Plot per-atom properties in 2D heatmap or 3D scatter mode. Use --type to select the plot style while keeping one unified command.
Examples
  1. 3D scatter of charges:
   reaxkit plot_atom_property --type scatter3d --property charge --frames 0 10 20 --save plots3d

  2. 2D heatmap of connectivity values:
   reaxkit plot_atom_property --type heatmap2d --property sum_BOs --plane xz --bins 60 --save heatmaps

  3. Export table without plotting:
   reaxkit plot_atom_property --type scatter3d --property q --export atom_charge_coords.csv
Arguments
Scientific choices
| Flag | Required | Default | Help | Choices |
|---|---|---|---|---|
--property |
No | Property to map: charge, q, partial_charge, sum_BOs, connectivity. Example: --property charge, which colors atoms by partial charge. | ||
--frames |
No | Frame selector syntax. Example: --frames 0:20:2, which selects frames 0,2,4,...,20. | ||
--every |
No | 1 | Use every Nth selected frame. Example: --every 5, which subsamples selected frames by a factor of five. | |
--atom-ids |
No | Restrict to selected 1-based atom ids. Example: --atom-ids 1 2 5, which keeps only those atoms. | ||
--atom-types |
No | Restrict to selected atom types/elements. Example: --atom-types O H, which keeps only oxygen and hydrogen. | ||
--type |
Yes | Plot type selector. Example: --type heatmap2d, which projects atom data and aggregates it on a 2D grid. | heatmap2d, scatter3d | |
--size |
No | 8.0 | Marker size for scatter3d. Example: --size 12, which renders larger point markers. | |
--alpha |
No | 0.9 | Marker transparency for scatter3d. Example: --alpha 0.6, which makes points more transparent. | |
--plane |
No | xy | Projection plane for heatmap2d. Example: --plane xz, which projects points onto XZ before binning. | xy, xz, yz |
--bins |
No | 40 | Grid bins for heatmap2d: "N" or "Nx,Ny". Example: --bins 80,60, which sets non-square grid resolution. | |
--agg |
No | mean | Aggregation for heatmap2d: mean|max|min|sum|count. Example: --agg max, which stores the maximum value in each bin. |
Input and file selection
| Flag | Required | Default | Help | Choices |
|---|---|---|---|---|
--engine |
No | Engine override. Example: --engine reaxff, which applies ReaxFF-specific loading rules. | reaxff, ams, lammps | |
--input |
No | . | Input file or directory for engine resolution. Example: --input runs/job1, which sets base context for file discovery. | |
--run-dir, --dir |
No | . | Run directory fallback for engine detection. Example: --run-dir runs/job1, which acts as backup lookup path. | |
--xmolout |
No | xmolout | Path to trajectory file. Example: --xmolout runs/job1/xmolout, which provides atom coordinates over frames. | |
--fort7 |
No | fort.7 | Path to fort.7 file. Example: --fort7 runs/job1/fort.7, which provides connectivity/bond-order data. | |
--summary |
No | Optional summary.txt path. Example: --summary runs/job1/summary.txt, which supplies auxiliary simulation metadata when available. |
Outputs and plots
| Flag | Required | Default | Help | Choices |
|---|---|---|---|---|
--save |
No | Directory used when saving frame plots. Example: --save plots3d, which writes one image per frame to that folder. | ||
--show |
No | False | Show the generated plot windows. Example: --show, which opens plots interactively. | |
--export |
No | Export the assembled per-atom table to CSV. Example: --export atom_values.csv, which saves coordinates and mapped values. | ||
--vmin |
No | Color scale minimum. Example: --vmin -0.5, which clamps the lower color bound. | ||
--vmax |
No | Color scale maximum. Example: --vmax 0.5, which clamps the upper color bound. | ||
--cmap |
No | Matplotlib colormap. Example: --cmap coolwarm, which sets the visualization color palette. | ||
--elev |
No | 22.0 | 3D view elevation for scatter3d. Example: --elev 30, which raises the camera tilt angle. | |
--azim |
No | 38.0 | 3D view azimuth for scatter3d. Example: --azim 120, which rotates camera around the scene. | |
--detail-format |
No | Optional detail format (default: Parquet; legacy: CSV). | parquet, csv |
Execution
| Flag | Required | Default | Help | Choices |
|---|---|---|---|---|
--execution |
No | auto | Execution backend; unsupported backends fall back to serial with a logged reason. | auto, serial, threads, processes |
--workers |
No | 0 | Frame workers: auto or N (default: auto). | |
--chunk-size |
No | 0 | Maximum in-flight frames: auto or N. |
Storage and cache
| Flag | Required | Default | Help | Choices |
|---|---|---|---|---|
--run-id |
No | Run identifier for run-scoped layout. Example: --run-id run_91ac0e, which reuses that run identifier. | ||
--project-root |
No | reaxkit_workspace | Project root that contains inputs/, data/, analysis/, etc. Example: --project-root ./workspace, which stores run artifacts there. | |
--analysis-id |
No | Optional analysis artifact id; defaults to run id. Example: --analysis-id comparison-a, which names the analysis artifact explicitly. | ||
--input-cache, --no-input-cache |
No | True | Reuse parsed input frames across commands (default: enabled; use --no-input-cache to force source reads for reproducibility checks or benchmarks). Example: --no-input-cache, which reloads frames from their source files. | |
--frame-cache-max-gb |
No | 10.0 | Maximum workspace frame-cache size in GiB (default: 10; use 0 for unlimited). Example: --frame-cache-max-gb 20, which caps cached frames at 20 GiB. | |
--output-profile |
No | standard | Select the shared artifact policy. Standard writes declared default outputs; minimal keeps core tables; full and legacy include optional details. Default: standard. Example: --output-profile full, which includes declared optional detail tables. | minimal, standard, full, legacy |
Diagnostics and compatibility
| Flag | Required | Default | Help | Choices |
|---|---|---|---|---|
-h, --help |
No | show this help message and exit | ||
--help-all, --all-flags |
No | Show every option, grouped by purpose. | ||
--log |
No | Logging level. Example: --log verbose, which prints more runtime details. | verbose, quiet |
The figure below shows an example output plot when plotting the charges of atoms at a specific frame across their 3D coordinates.
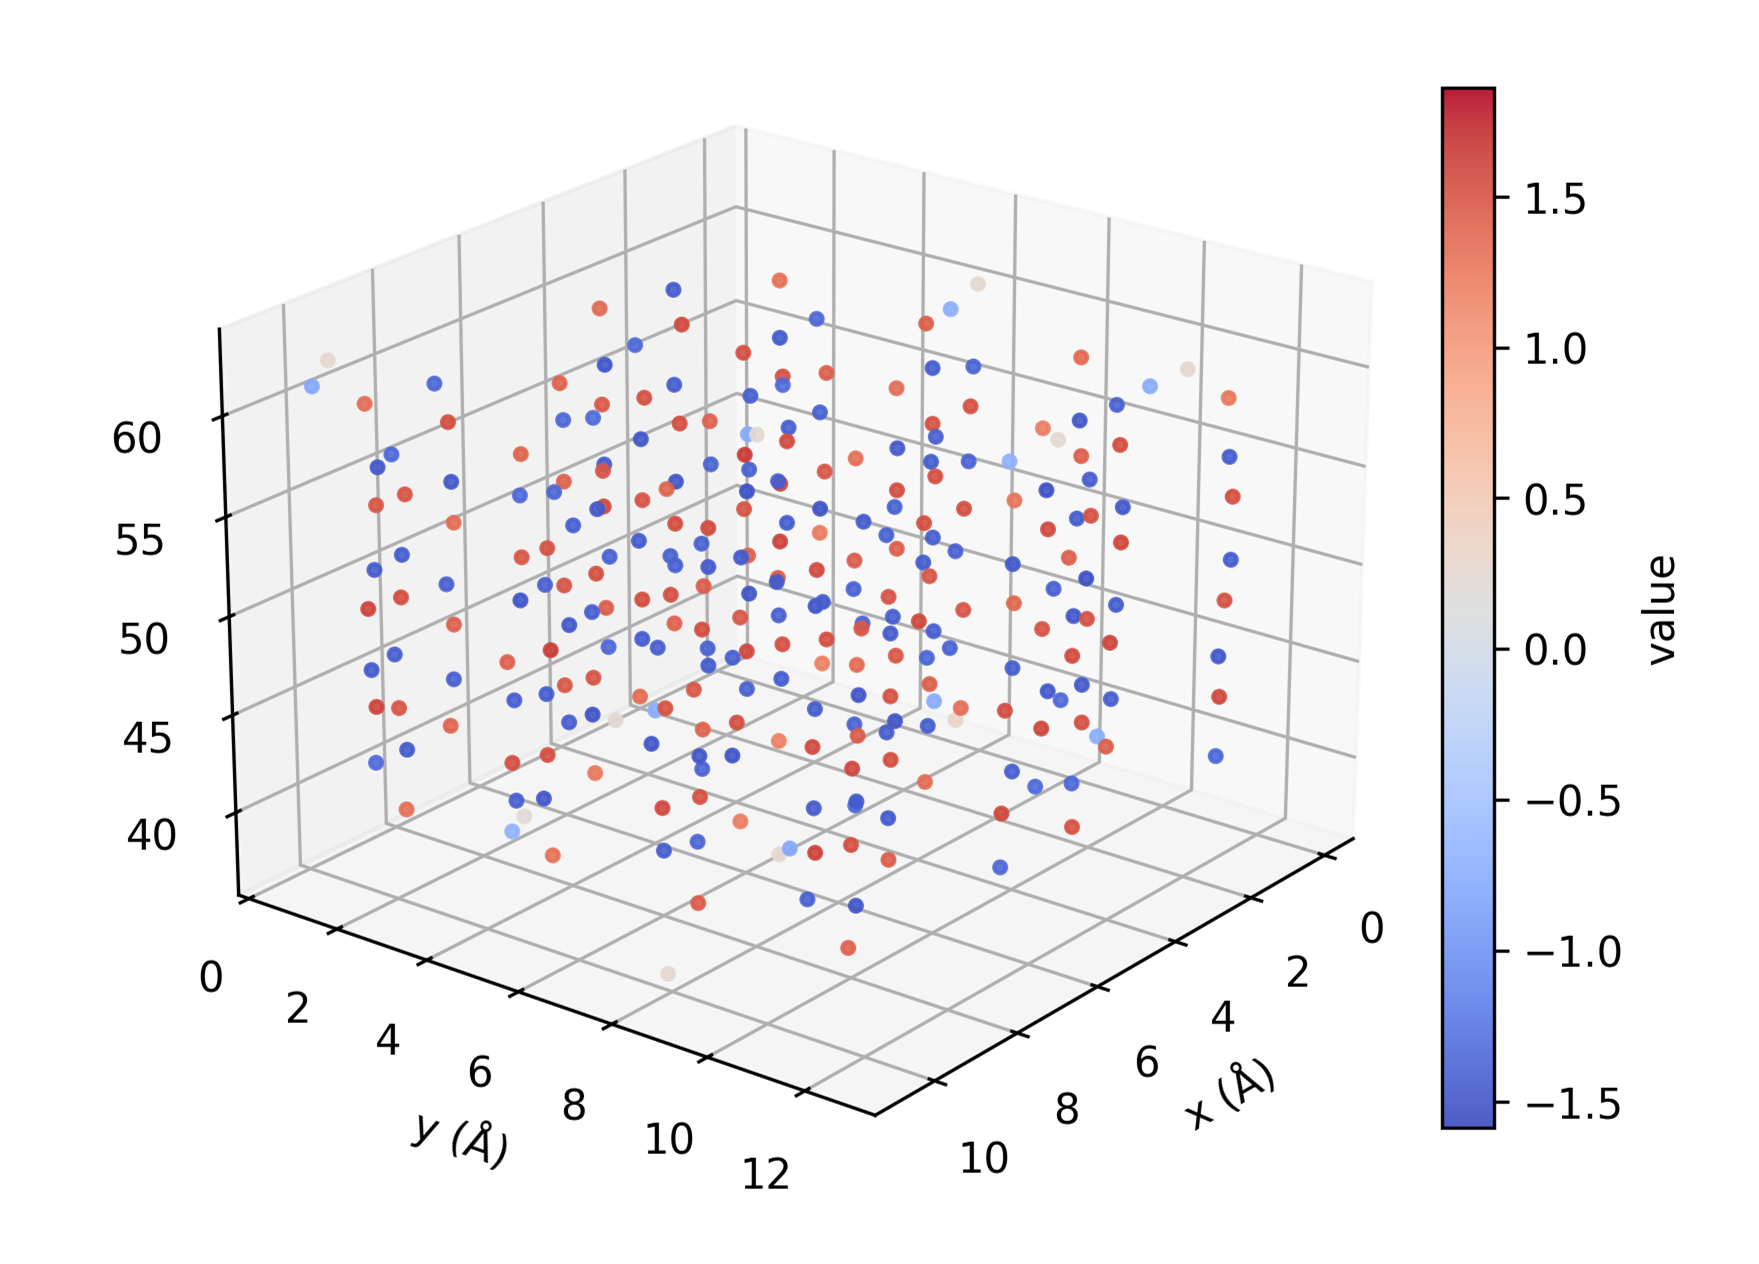
Figure: Sample plot for charges of atoms at a specific frame across their 3D coordinates.
Common Runtime and Presentation Arguments
These are shared workflow-level CLI flags added before command-specific options, covering runtime context (engine/input/storage) and output presentation/export behavior.
Each command table above includes its shared and inherited options.