Connectivity Analysis
Provide engine-agnostic connectivity and bond-event analyzer tasks.
This module extracts connection lists, connection matrices, aggregated connectivity statistics, and bond formation/breakage events from bond-order trajectories. It is limited to connectivity-domain signals and does not compute geometric descriptors outside bond-order-derived relationships.
Usage context
- Bond-network inspection: Build edge tables and per-frame connectivity matrices.
- Aggregation workflows: Compute pairwise connectivity statistics over time.
- Reaction-event tracking: Detect bond formation/breakage with hysteresis logic.
Request: ConnectionListRequest
Request for extracting frame-resolved bond connections.
Fields
| Field | Type | Default | Help | Choices |
|---|---|---|---|---|
frames |
Optional[Sequence[int]] |
Optional frame indices to include. Example: [0, 10, 20]. | ||
every |
int |
1 | Stride for selected frames. Example: every=5. | |
min_bo |
float |
0.0 | Minimum bond-order threshold for connection inclusion. Example: 0.3. | |
undirected |
bool |
True | Merge i-j and j-i into one edge when true. | True, False |
include_self |
bool |
False | Include self-edges (src == dst) when true. | True, False |
Examples
req = ConnectionListRequest(frames=[0, 10, 20], min_bo=0.3, undirected=True)
Sample output:
ConnectionListRequest(...)
Meaning:
The request configures frame sampling and edge-threshold extraction rules.
Task: ConnectionListTask
Method: recommended_presentations(_result: ConnectionListResult, payload: dict[str, Any])
Build default table/plot presentations for connection-list outputs.
Works on
Analyzer task output payloads
Parameters
| Name | Type | Description |
|---|---|---|
_result |
ConnectionListResult |
Analysis result object for the executed task. |
payload |
dict[str, Any] |
Serialized result payload used by presentation dispatch. |
Returns
| Type | Description |
|---|---|
list[PresentationSpec] |
Recommended renderer specs for table and BO trend plot. |
Examples
specs = ConnectionListTask.recommended_presentations(result, payload)
Sample output:
Table view plus BO vs frame_idx plot view.
Meaning:
Connection-list outputs can be rendered with default mappings.
Method: run(data: ConnectivityData, request: ConnectionListRequest, reporter=None)
Extract frame-resolved connectivity edges from bond-order matrices.
Works on
ConnectivityData plus ConnectionListRequest analyzer inputs
Parameters
| Name | Type | Description |
|---|---|---|
data |
ConnectivityData |
Connectivity series containing bond-order matrices and metadata. |
request |
ConnectionListRequest |
Selection and threshold configuration for edge extraction. |
reporter |
Any, optional |
Optional progress callback invoked during frame processing. |
Returns
| Type | Description |
|---|---|
ConnectionListResult |
Edge table with one row per qualifying bond occurrence. |
Examples
result = ConnectionListTask().run(data, ConnectionListRequest(min_bo=0.2))
Sample output:
result.table with columns including source, destination, and BO.
Meaning:
Qualifying bond-order edges are emitted per selected frame.
Result: ConnectionListResult
Connection-list extraction result.
Fields
| Field | Type | Default | Help | Choices |
|---|---|---|---|---|
table |
pd.DataFrame |
|||
request |
ConnectionListRequest |
Examples
result = ConnectionListTask().run(data, req)
result.table.head()
Sample output: DataFrame rows for each selected edge occurrence. Meaning: Each row is one bond edge record at one frame.
Request: ConnectionTableRequest
Request for a single-frame connectivity matrix.
Fields
| Field | Type | Default | Help | Choices |
|---|---|---|---|---|
frame |
int |
0 | Frame index to extract from the connectivity series. Example: 0. | |
min_bo |
float |
0.0 | Minimum bond-order threshold for including edges. Example: 0.3. | |
undirected |
bool |
True | Merge i-j and j-i into one edge when true. | True, False |
fill_value |
float |
0.0 | Fill value for missing matrix cells after pivot. Example: 0.0. |
Examples
req = ConnectionTableRequest(frame=0, min_bo=0.3, undirected=True)
Sample output:
ConnectionTableRequest(...)
Meaning:
The request configures one-frame connectivity-matrix extraction.
Task: ConnectionTableTask
Method: recommended_presentations(_result: ConnectionTableResult, payload: dict[str, Any])
Build default table/plot presentations for connection-table outputs.
Works on
Analyzer task output payloads
Parameters
| Name | Type | Description |
|---|---|---|
_result |
ConnectionTableResult |
Analysis result object for the executed task. |
payload |
dict[str, Any] |
Serialized result payload used by presentation dispatch. |
Returns
| Type | Description |
|---|---|
list[PresentationSpec] |
Recommended renderer specs for table and optional numeric projection. |
Examples
specs = ConnectionTableTask.recommended_presentations(result, payload)
Sample output: Table view and optionally one simple plot mapping. Meaning: Matrix outputs get at least a tabular default view.
Method: run(data: ConnectivityData, request: ConnectionTableRequest, reporter=None)
Build a one-frame connectivity matrix from extracted edge list.
Works on
ConnectivityData plus ConnectionTableRequest analyzer inputs
Parameters
| Name | Type | Description |
|---|---|---|
data |
ConnectivityData |
Connectivity series containing bond-order matrices and metadata. |
request |
ConnectionTableRequest |
One-frame matrix extraction configuration. |
reporter |
Any, optional |
Optional progress callback forwarded to edge extraction. |
Returns
| Type | Description |
|---|---|
ConnectionTableResult |
Pivoted connectivity matrix result for selected frame. |
Examples
result = ConnectionTableTask().run(data, ConnectionTableRequest(frame=0))
Sample output:
result.table as a source-by-destination bond-order matrix.
Meaning:
Edges are thresholded/normalized before matrix pivot.
Result: ConnectionTableResult
Connection-table extraction result.
Fields
| Field | Type | Default | Help | Choices |
|---|---|---|---|---|
table |
pd.DataFrame |
|||
request |
ConnectionTableRequest |
Examples
result = ConnectionTableTask().run(data, req)
Sample output:
Matrix-like DataFrame where table.loc[src, dst] is bond order.
Meaning:
Missing edges are filled using request.fill_value.
Request: ConnectionStatsRequest
Request for aggregated connectivity statistics across frames.
Fields
| Field | Type | Default | Help | Choices |
|---|---|---|---|---|
frames |
Optional[Sequence[int]] |
Optional frame indices to include. Example: [0, 10, 20]. | ||
every |
int |
1 | Stride for selected frames. Example: every=5. | |
min_bo |
float |
0.0 | Minimum BO threshold before aggregation. Example: 0.3. | |
undirected |
bool |
True | Merge i-j and j-i into one pair when true. | True, False |
how |
Literal['mean', 'max', 'count'] |
mean | Aggregation statistic for each source/destination pair across selected frames. | mean, max, count |
Examples
req = ConnectionStatsRequest(how="mean", min_bo=0.3)
Sample output:
ConnectionStatsRequest(...)
Meaning:
The request configures pairwise connectivity aggregation behavior.
Task: ConnectionStatsTask
Method: recommended_presentations(_result: ConnectionStatsResult, payload: dict[str, Any])
Build default table/plot presentations for connection-stats outputs.
Works on
Analyzer task output payloads
Parameters
| Name | Type | Description |
|---|---|---|
_result |
ConnectionStatsResult |
Analysis result object for the executed task. |
payload |
dict[str, Any] |
Serialized result payload used by presentation dispatch. |
Returns
| Type | Description |
|---|---|
list[PresentationSpec] |
Recommended renderer specs for table and stats plot view. |
Examples
specs = ConnectionStatsTask.recommended_presentations(result, payload)
Sample output:
Table view plus value vs source grouped plot.
Meaning:
Aggregated connectivity stats have default visual mappings.
Method: run(data: ConnectivityData, request: ConnectionStatsRequest, reporter=None)
Aggregate connectivity edges across frames into pairwise statistics.
Works on
ConnectivityData plus ConnectionStatsRequest analyzer inputs
Parameters
| Name | Type | Description |
|---|---|---|
data |
ConnectivityData |
Connectivity series containing bond-order matrices and metadata. |
request |
ConnectionStatsRequest |
Aggregation configuration (how, thresholds, and frame selection). |
reporter |
Any, optional |
Optional progress callback forwarded to edge extraction. |
Returns
| Type | Description |
|---|---|
ConnectionStatsResult |
Pairwise aggregated connectivity statistic table. |
Examples
result = ConnectionStatsTask().run(data, ConnectionStatsRequest(how="count"))
Sample output:
result.table with one row per source-destination pair.
Meaning:
Edge behavior is summarized according to the selected aggregation method.
Result: ConnectionStatsResult
Connection-statistics aggregation result.
Fields
| Field | Type | Default | Help | Choices |
|---|---|---|---|---|
table |
pd.DataFrame |
|||
request |
ConnectionStatsRequest |
Notes
value semantics depend on request.how (mean, max, or count).
Examples
result = ConnectionStatsTask().run(data, req)
Sample output:
Aggregated rows per atom pair with statistic in value.
Meaning:
Pairwise connectivity behavior is condensed across selected frames.
Request: BondEventsRequest
Request for bond formation/breakage event detection.
Fields
| Field | Type | Default | Help | Choices |
|---|---|---|---|---|
frames |
Optional[Sequence[int]] |
Optional frame indices to include. Example: [0, 10, 20]. | ||
every |
int |
1 | Stride for selected frames. Example: every=5. | |
src |
Optional[int] |
Optional source atom id filter. Example: 12. | ||
dst |
Optional[int] |
Optional destination atom id filter. Example: 27. | ||
threshold |
float |
0.35 | Schmitt trigger threshold for switching bonded/unbonded states. Example: 0.35. | |
hysteresis |
float |
0.05 | Hysteresis half-width around threshold for robust transitions. Example: 0.05. | |
smooth |
Optional[Literal['ma', 'ema']] |
ma | Optional smoothing method applied before event detection. | ma, ema |
window |
int |
7 | Smoothing window size for moving-average based preprocessing. Example: 7. | |
ema_alpha |
Optional[float] |
Optional EMA alpha override. Example: 0.2. | ||
min_run |
int |
3 | Minimum consecutive state length after hysteresis cleanup. Example: 3. | |
undirected |
bool |
True | Merge i-j and j-i into one bond when true. | True, False |
Notes
Upstream min_bo controls which BO entries exist, while threshold and
hysteresis govern event transition detection on those traces.
Examples
req = BondEventsRequest(threshold=0.35, hysteresis=0.05, smooth="ma")
Sample output:
BondEventsRequest(...)
Meaning:
The request configures bond event detection and optional smoothing logic.
Parameters
frames: Optional frame indices to include. If omitted, all frames are used. Example:[0, 10, 20].every: Frame stride after selection. Example:every=5.src: Optional source atom-id filter. Example:src=12.dst: Optional destination atom-id filter. Example:dst=27.threshold: Central threshold for Schmitt trigger transition logic. Example:threshold=0.35. NOTE: min_bo filters which bond-order entries exist in the input data, while threshold (with hysteresis) decides when a bond’s time-series crosses between unbonded and bonded states to mark breakage/formation events.hysteresis: Hysteresis half-width aroundthreshold. Example:hysteresis=0.05.smooth: Optional pre-filter on BO traces before event detection:mafor moving average,emafor exponential moving average.window: Smoothing window size used bysmoothmethod. Example:window=9.ema_alpha: Optional explicit EMA alpha; if omitted, alpha is inferred from window.min_run: Minimum consecutive-state run length after hysteresis, used to clean flicker. Example:min_run=3.undirected: IfTrue, treati-jandj-ias the same bond.
Task: BondEventsTask
Method: recommended_presentations(_result: BondEventsResult, payload: dict[str, Any])
Build default table/plot presentations for bond-event outputs.
Works on
Analyzer task output payloads
Parameters
| Name | Type | Description |
|---|---|---|
_result |
BondEventsResult |
Analysis result object for the executed task. |
payload |
dict[str, Any] |
Serialized result payload used by presentation dispatch. |
Returns
| Type | Description |
|---|---|
list[PresentationSpec] |
Recommended renderer specs for event table and event trace plot. |
Examples
specs = BondEventsTask.recommended_presentations(result, payload)
Sample output:
Table view plus bo_at_event vs iter grouped by event type.
Meaning:
Detected events can be visualized with default mappings.
The figure below shows an example output plot where the raw timeseries data of bond order between 2 atoms are shown, the EMA smoothing signal is also plotted on top. As can be seen, with the current setting, multiple bond formation and breakage has been detected. Users should adjust the parameters for their system of choice so that bond breakage/formation is detected correctly .
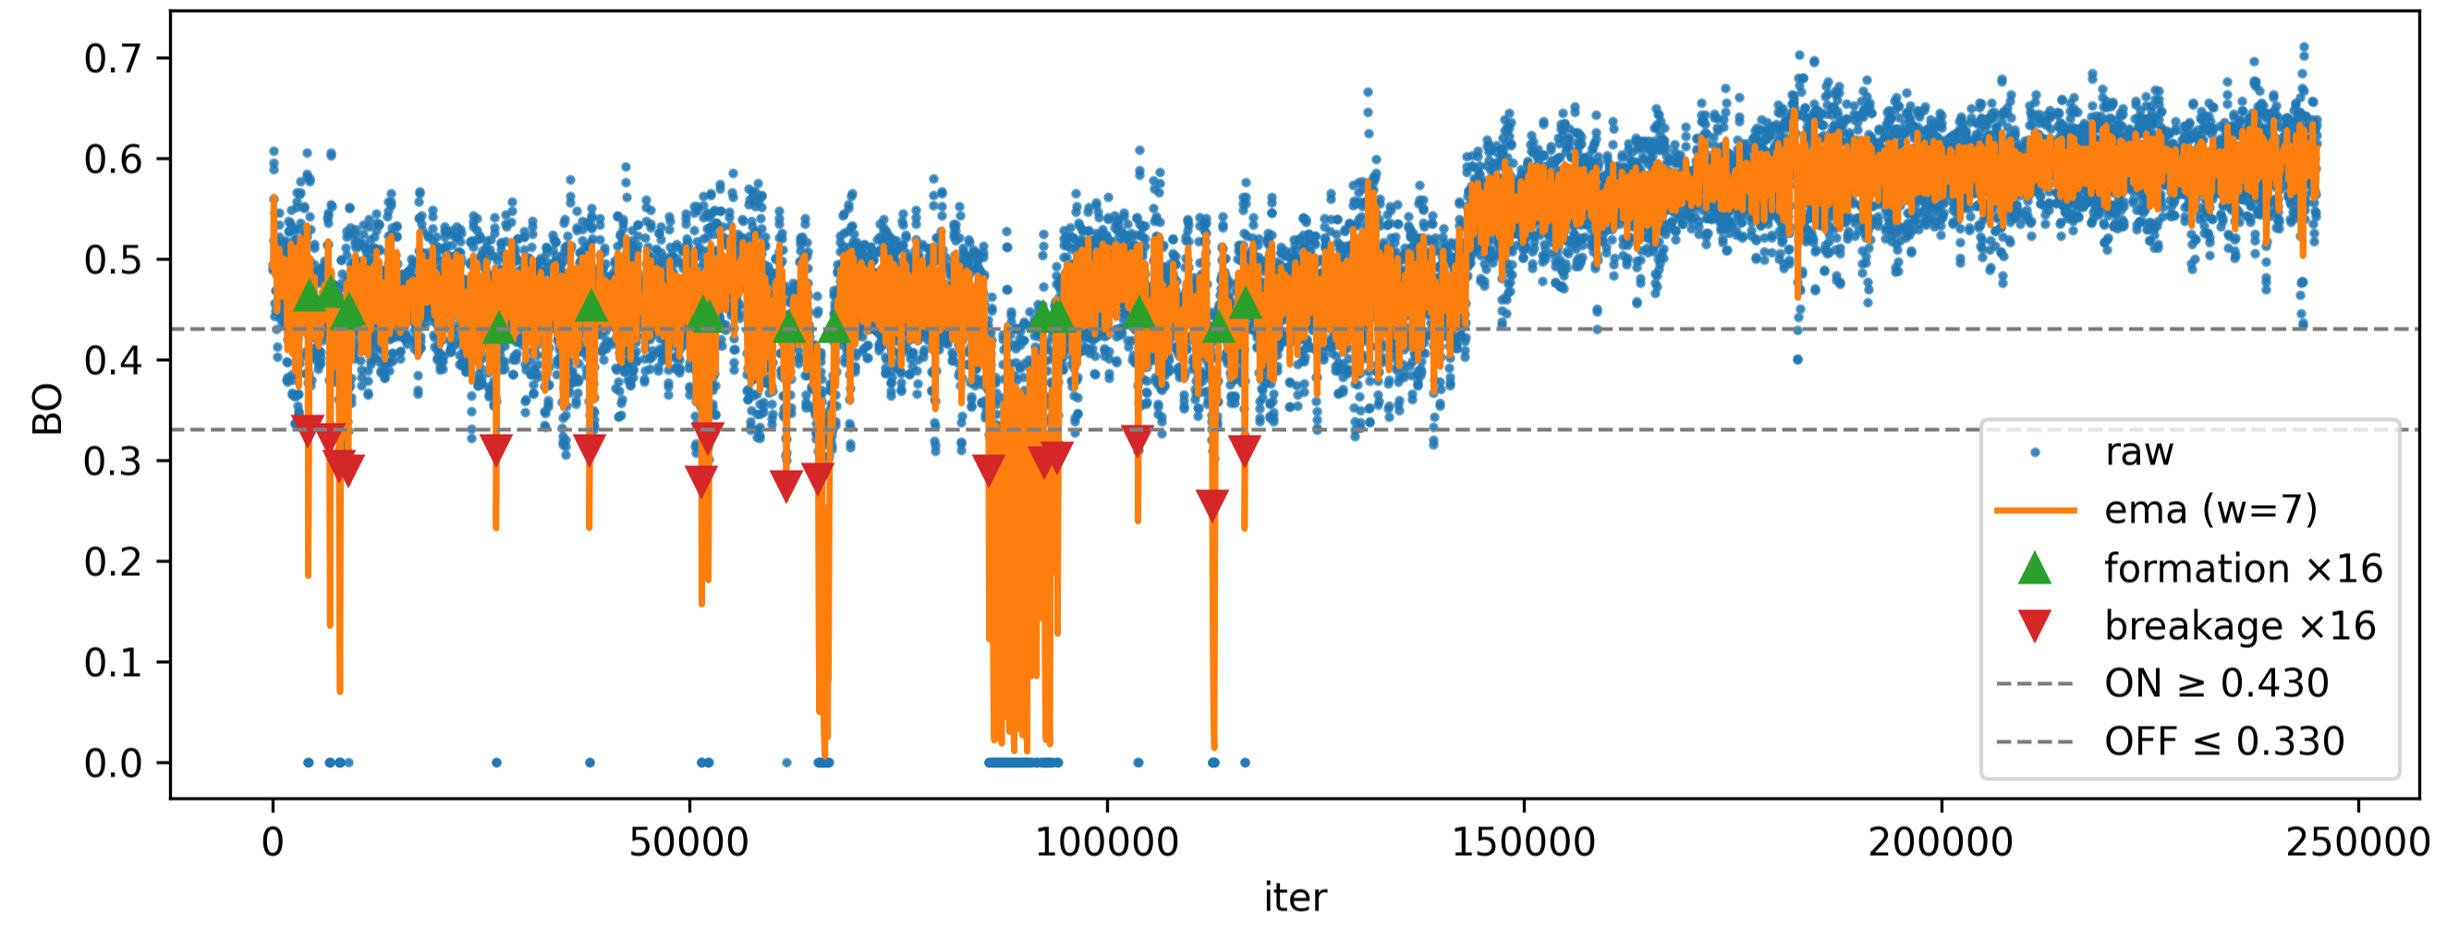
Figure: Sample bond events plot with detected bond breakage/formation iterations.
Method: run(data: ConnectivityData, request: BondEventsRequest, reporter=None)
Detect bond formation and breakage transitions from BO time series.
Works on
ConnectivityData plus BondEventsRequest analyzer inputs
Parameters
| Name | Type | Description |
|---|---|---|
data |
ConnectivityData |
Connectivity series containing bond-order matrices and metadata. |
request |
BondEventsRequest |
Event detection, smoothing, and filtering configuration. |
reporter |
Any, optional |
Optional progress callback invoked during grouped event detection. |
Returns
| Type | Description |
|---|---|
BondEventsResult |
Event transition table for selected bond pairs. |
Examples
result = BondEventsTask().run(data, BondEventsRequest(src=1, dst=2))
Sample output:
result.table rows with event, frame_idx, and bo_at_event.
Meaning:
Bond-state transitions are extracted using hysteresis logic.
Result: BondEventsResult
Bond-event detection result.
Fields
| Field | Type | Default | Help | Choices |
|---|---|---|---|---|
table |
pd.DataFrame |
|||
request |
BondEventsRequest |
Examples
result = BondEventsTask().run(data, req)
result.table.head()
Sample output:
Event rows labeled as formation or breakage.
Meaning:
Each row marks one detected bond-state transition.
Output structure
request: the :class:BondEventsRequestused for event detection.table: pandas.DataFrame with columns:['source', 'source_type', 'destination', 'destination_type', 'event', 'frame_idx', 'iter', 'bo_at_event', 'threshold', 'hysteresis'].
Column meanings
source/destination: atom-id pair where the event was detected.source_type/destination_type: atom element/type labels.event: event class, one offormationorbreakage.frame_idx/iter: frame and iteration location for the event.bo_at_event: BO value (possibly smoothed) at detection point.threshold/hysteresis: parameters used for detection.
Example
A row like source=3, source_type='C', destination=7, destination_type='O',
event='formation', frame_idx=12, iter=1200, bo_at_event=0.41 indicates
bond 3-7 formed at that point.